Tag: web analytics

  • Unlocking Growth: The Power of A/B Testing for Higher Conversions

    Unlocking Growth: The Power of A/B Testing for Higher Conversions

    The Science Behind A/B Testing: More Than Just Guesswork

    Anyone who has ever managed a website or digital campaign knows that what looks great in a design file doesn’t always deliver results in the real world. Sometimes, changing a button from blue to green, tweaking a headline, or slightly altering the call to action can mean the difference between a visitor who bounces and one who converts. But how do you move from intuition or anecdote to evidence-based results? This is where A/B testing, sometimes called split testing, becomes an indispensable tool for any modern digital strategy.

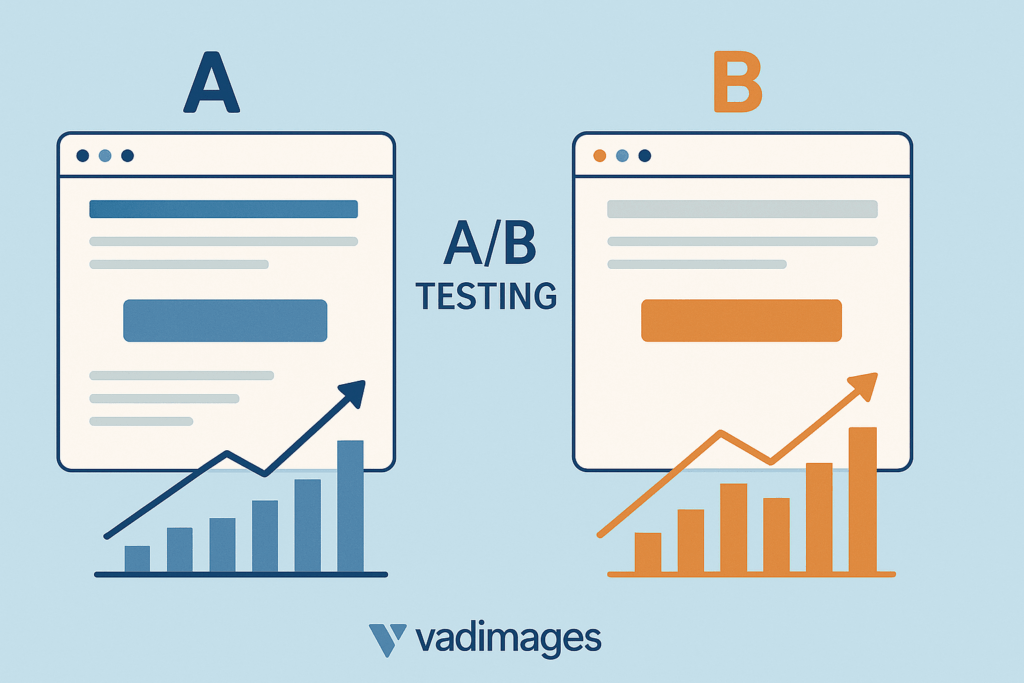
    A/B testing is the systematic process of comparing two versions of a web page, email, or interface element to determine which performs better in terms of a specific goal—usually conversions. By randomly splitting traffic between version A (the control) and version B (the variant), you can objectively measure the effect of a single change while controlling for outside variables. This method transforms web design from a creative gamble into a measurable, repeatable science. At Vadimages, we’ve seen firsthand how even seemingly minor design or copy tweaks can deliver outsized gains in lead generation, sales, and user engagement.

    Illustration of two nearly identical landing pages with highlighted differences, showing a typical A/B test scenario with conversion graphs emerging from each

    Why Small Changes Create Big Impacts

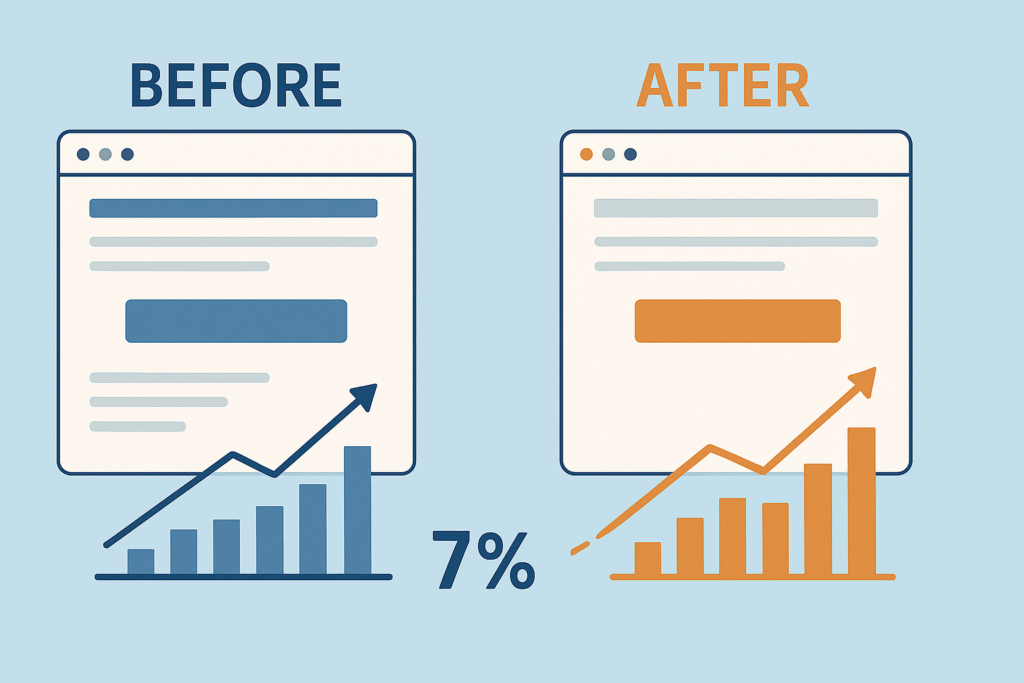
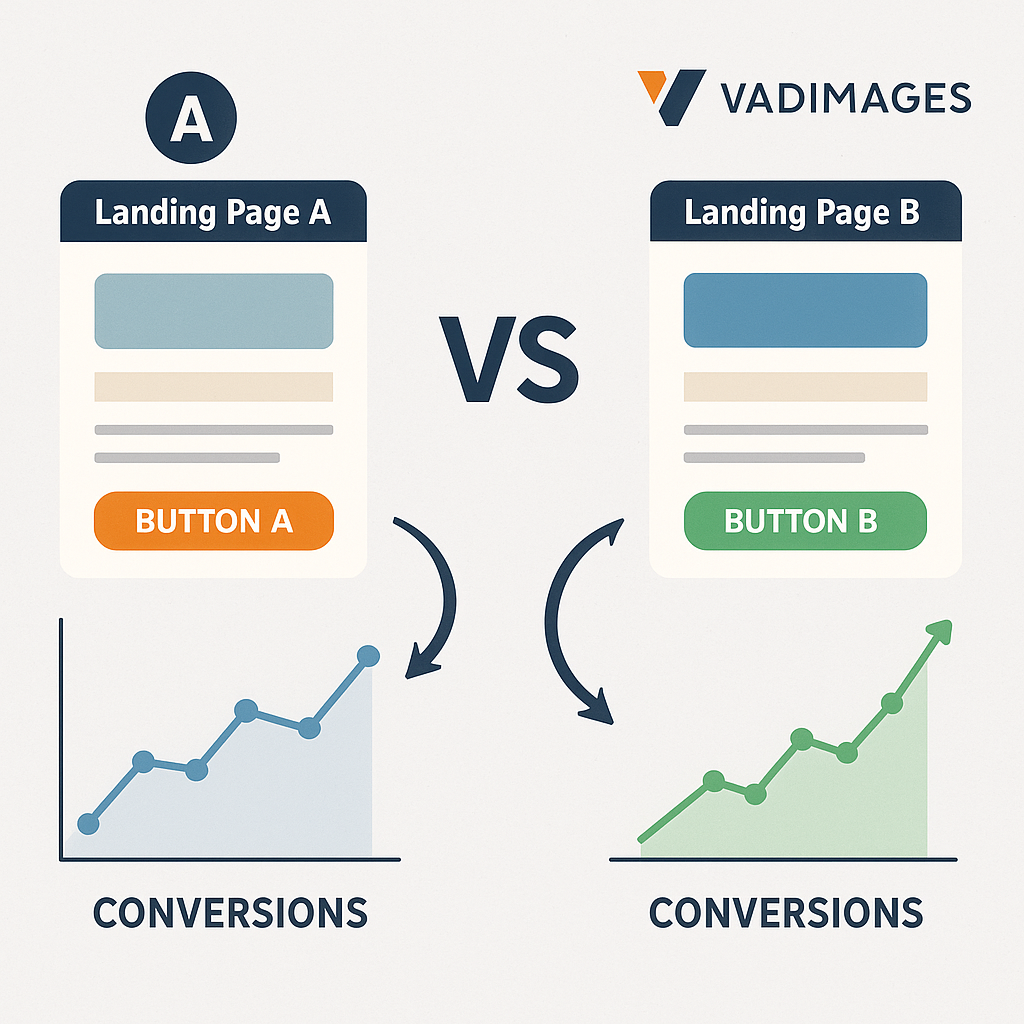
    To the untrained eye, a headline swap or a slight adjustment to a call-to-action button might seem trivial. In reality, these small tweaks often create disproportionate improvements in user behavior. That’s because every aspect of a digital experience—the words you use, the colors you choose, the placement of a form—contributes to a user’s sense of clarity, trust, and urgency. For example, changing a CTA from “Submit” to “Get My Free Guide” can dramatically increase click-through rates by reducing friction and enhancing perceived value.

    One of the most compelling aspects of A/B testing is its ability to validate or disprove assumptions. Rather than relying on the highest-paid person’s opinion or copying the latest trend, you let your own audience’s real actions guide decisions. It’s this evidence-based approach that allows leading brands to continually refine their messaging, layout, and offers for maximum impact. At Vadimages, we often encourage clients to test even the smallest elements—button colors, testimonial layouts, headline phrasing—because it’s often these micro-optimizations that add up to major revenue wins over time.

    Data visualization showing before-and-after conversion rates from an A/B test on a landing page, emphasizing the dramatic effect of a small change.

    A/B Testing in Action: Steps, Strategies, and Pitfalls to Avoid

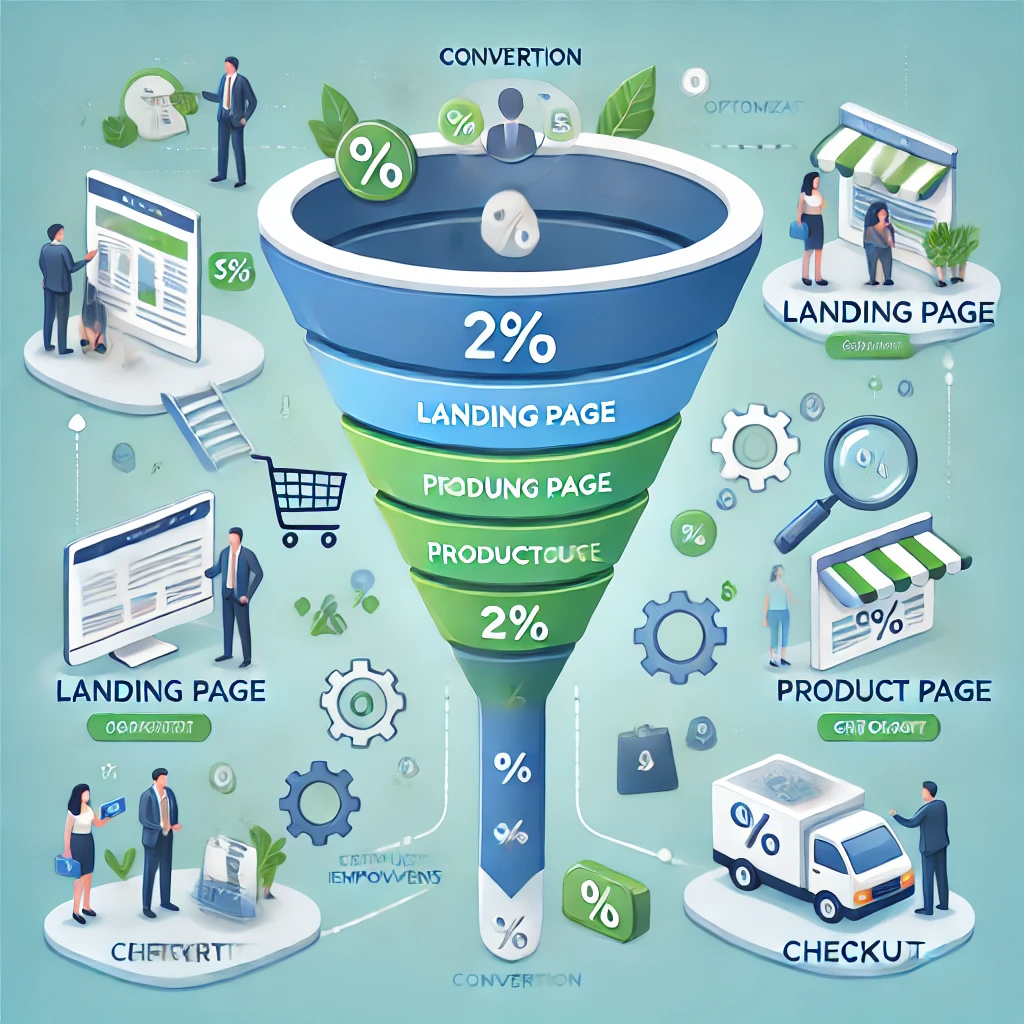
    The process of running an effective A/B test involves more than just setting up a tool and waiting for results. It starts with a well-formed hypothesis based on data or user feedback. For instance, if analytics show that visitors abandon your checkout page at a high rate, you might hypothesize that reducing the number of form fields will improve completions. You then create two versions: the current layout and one with fewer required fields. By carefully splitting your traffic, tracking conversions, and running the test long enough to achieve statistical significance, you gain insights that aren’t just interesting—they’re actionable.

    However, successful A/B testing also requires discipline. Changing too many variables at once muddies the results, while calling a test too early can produce false positives. It’s important to have patience, use reliable tracking, and understand that sometimes the “losing” version offers just as much insight for future improvements. At Vadimages, our web development and CRO specialists help clients not just set up tests, but interpret results in the context of their unique goals and user segments, ensuring that every test contributes to long-term growth.

    Flowchart or step-by-step diagram illustrating the A/B testing lifecycle, from hypothesis and variant creation to launch, analysis, and implementation

    The Vadimages Approach: Turning Testing Into Tangible Results

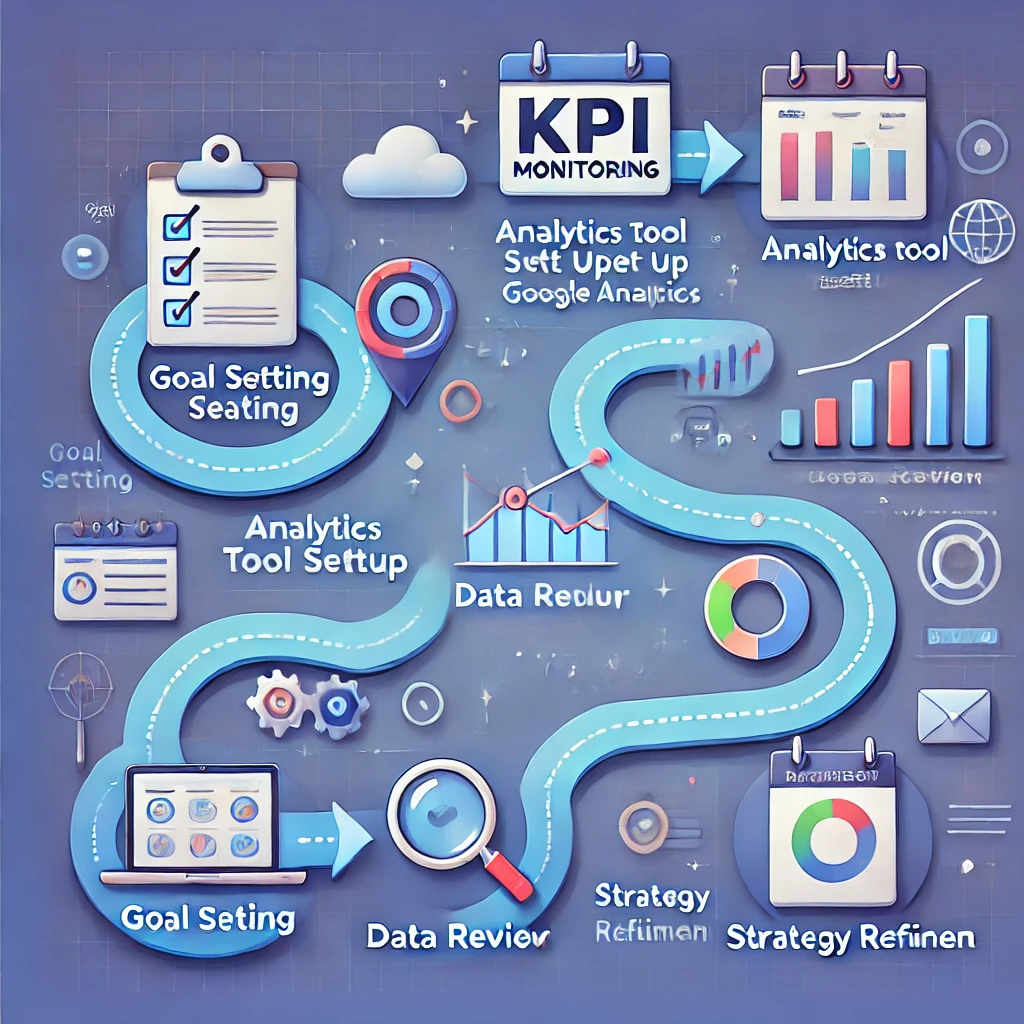
    At Vadimages, A/B testing is not a one-off tactic—it’s an ongoing commitment to continuous improvement. Our philosophy is simple: every visitor is an opportunity, and every touchpoint is a testable moment. Whether you’re launching a new product, refining your lead generation funnel, or scaling up an e-commerce platform, our team brings deep expertise in both the technical and psychological sides of conversion rate optimization. We deploy industry-leading testing tools, integrate analytics directly with your backend systems, and deliver clear, actionable reports so you always know what’s working and why.

    Beyond the numbers, Vadimages takes the guesswork out of digital growth by partnering closely with clients to develop hypotheses rooted in business goals and customer insights. We blend creative flair with scientific rigor, ensuring that every A/B test moves your brand forward. From web design and development to copywriting and UX, our solutions are tailored for your market—and always engineered for results. Ready to see what a single test could do for your bottom line? Let Vadimages show you how the smallest change can become your next big breakthrough.

    Hero-style image showing Vadimages team collaborating with clients over data dashboards, creative wireframes, and live test results

    Unlock your website’s true potential with Vadimages—your partner for smarter, faster, and higher-converting digital experiences.

    Ready to start A/B testing that actually moves the needle? Contact Vadimages for a free consultation or case study tailored to your business!


  • Mastering Web Analytics: A Comprehensive Guide to Tracking KPIs

    Mastering Web Analytics: A Comprehensive Guide to Tracking KPIs

    In today’s digital landscape, tracking your website’s performance is essential to understanding user behavior, enhancing user experience, and driving business growth. Key Performance Indicators (KPIs) such as pageviews, bounce rates, and conversion rates serve as critical metrics that provide actionable insights into your website’s effectiveness. By mastering how to measure and interpret these KPIs, you can significantly improve your website’s performance and achieve your business goals more effectively.

    Understanding the Importance of KPIs in Web Development

    Understanding the Importance of KPIs in Web Development

    KPIs are quantifiable metrics that help businesses evaluate success against specific objectives. They offer a clear picture of how well your website performs, indicating areas of strength and revealing opportunities for improvement. As web development continues to evolve, KPIs become increasingly essential for ensuring your website not only looks great but also delivers measurable results.

    For example, a high pageview count might indicate strong content or effective SEO practices, but when paired with high bounce rates, it may suggest that visitors are not finding the information they need. Conversion rates, on the other hand, demonstrate your website’s effectiveness in turning visitors into customers, making it a critical indicator of your site’s overall profitability.

    Measuring and Analyzing Pageviews and Bounce Rates

    Measuring and Analyzing Pageviews and Bounce Rates

    Pageviews measure the number of times users have loaded or reloaded your web pages, reflecting overall site traffic and content popularity. While a high number of pageviews can initially seem positive, it’s crucial to analyze this data alongside bounce rates. Bounce rates indicate the percentage of visitors who leave your site after viewing only one page.

    A high bounce rate might imply that your landing pages are not engaging enough, content is not relevant to user expectations, or website navigation is confusing. At Vadimages Web Development Studio, we specialize in creating user-friendly websites designed to minimize bounce rates through engaging content, intuitive navigation, and visually appealing design.

    Consider regularly monitoring these KPIs through tools like Google Analytics. Look closely at pages with high bounce rates and explore potential reasons such as slow loading speeds, poor mobile optimization, or unclear content structure. Optimizing these factors can dramatically improve your overall user experience and reduce bounce rates.

    Conversion Rates: Turning Visitors into Customers

    Conversion Rates: Turning Visitors into Customers

    Conversion rates are arguably the most valuable KPI, reflecting your website’s ability to persuade visitors to perform desired actions such as purchasing a product, subscribing to a newsletter, or filling out a contact form. Calculating your conversion rate is straightforward: divide the number of conversions by the total number of visitors, then multiply by 100 to get a percentage.

    Improving your conversion rate involves multiple strategies including A/B testing different webpage elements, streamlining the checkout process, and optimizing call-to-actions (CTAs). Vadimages helps businesses identify conversion roadblocks through detailed user experience (UX) analysis and comprehensive web development solutions that ensure seamless user journeys.

    Implementing a KPI Monitoring Strategy

    Implementing a KPI Monitoring Strategy

    Successfully tracking and interpreting KPIs involves more than simply reviewing analytics reports periodically. It requires setting clear objectives aligned with your business goals and regularly reviewing KPI performance to inform ongoing website enhancements.

    To effectively implement KPI monitoring, begin by defining your key objectives clearly. Decide which metrics will best represent your goals, whether it’s increasing user engagement, improving sales, or expanding brand awareness. Next, integrate analytics tracking software deeply into your website infrastructure. Tools such as Google Analytics and Hotjar provide comprehensive insights into user behavior and website performance.

    Regular reviews and adjustments based on these insights are crucial. Schedule periodic audits to ensure your analytics are capturing accurate data, and use this information to refine your web design and content strategy continuously.

    Vadimages Web Development Studio: Your Partner in Web Analytics

    Vadimages Web Development Studio: Your Partner in Web Analytics

    At Vadimages, we understand the critical role KPIs play in your online success. Our expert team specializes in creating websites tailored to optimize performance metrics, enhance user experiences, and boost conversions. With our holistic approach to web development, we ensure your website not only meets but exceeds your business expectations.

    Our comprehensive web solutions include advanced analytics integration, detailed UX/UI analysis, and ongoing performance monitoring to help you achieve tangible results. Partnering with Vadimages means investing in clarity, performance, and growth.

    Final Thoughts

    Effectively tracking and interpreting KPIs like pageviews, bounce rates, and conversion rates provides invaluable insights into your website’s performance. It allows you to identify strengths, address weaknesses proactively, and significantly enhance user experience and profitability. Vadimages Web Development Studio is committed to helping you leverage these insights effectively, ensuring your digital presence consistently delivers outstanding results.